The interactive map feature for the blog is still being developed, but this screen shot is an example of what will be seen once the map is running.

Each crime category has its own symbol which is used on the map. The website allows for crimes to searched by category and by date.
The information is provided to the website by the Pottstown Police Department. After the data is plotted on the virtual map, the website generates graphs that are available and free to the public.
Here are examples of the graphs provided by www.crimemapping.com for crimes committed in October 2013 around the borough:

The pie chart generated by www.crimemapping.com shows what percentage each crime category was out of the 286 total crimes.
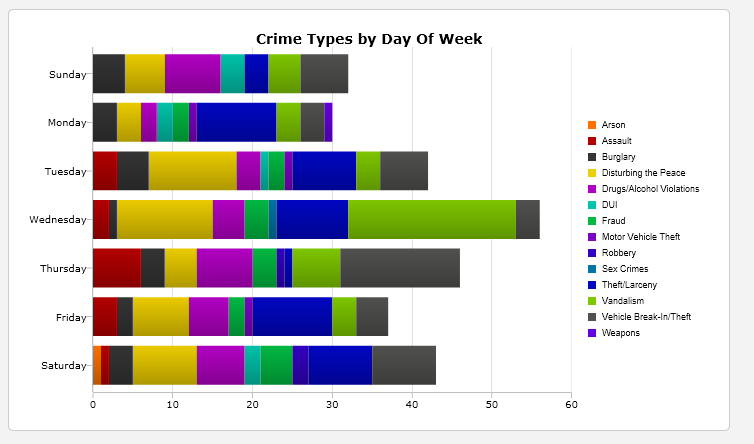
Another graph created by www.crimemapping.com sections off how many of each type of crime was committed on each day of the week.
If a crime did not occur, it does not get factored into the graphs for the selected time period.
No comments:
Post a Comment